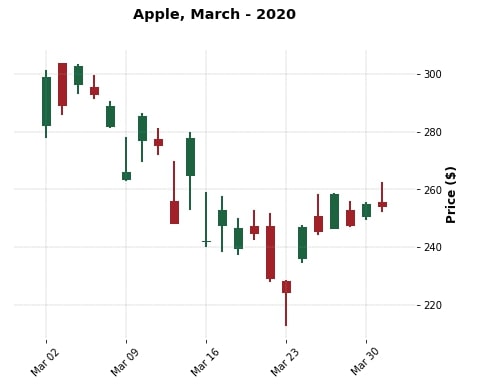
 There are several Python libraries that can be used to plot interactive candlesticks for trading. Some popular ones include:
Matplotlib is a widely used library for creating static and interactive visualizations in Python. It has a module called mplfinance that provides functions to plot financial data, including candlestick charts. Matplotlib is widely used and well-documented. Has a module called mplfinance specifically for plotting financial data, including candlestick charts. It’s flexible and customizable but can be complex to learn and use for beginners. Interactive capabilities are limited compared to other libraries.
Plotly is a web-based visualization library that allows you to create interactive charts and dashboards. It has a finance module that provides functions to create candlestick charts, as well as other financial charts. Plotly is web-based, so charts can be easily shared and embedded in web pages. It’s highly customizable and interactive and has a finance module specifically for creating financial charts, including candlestick charts. With all said, it has limited offline capabilities for free users and requires a Plotly account to save charts.
Bokeh is a Python library for creating interactive visualizations for the web. It has a module called bokeh.plotting that provides functions to create candlestick charts. Provides highly interactive and customizable visualizations and can be used for both desktop and web-based applications. It has a separate module called bokeh.plotting that provides functions to create candlestick charts. While it’s the most advanced library, it can be more difficult to learn and use compared to other libraries.
Plotnine is a Python library that provides a grammar of graphics for creating static and interactive visualizations. It has a geom_candlestick function that can be used to create candlestick charts. Provides high-level abstraction and simple syntax for creating visualizations. It’s because it’s based on the grammar of graphics, making it easy to understand and use. Has a geom_candlestick function that can be used to create candlestick charts. Downsides include limited interactive capabilities compared to other libraries as well as the fact that it can be slower than other libraries for larger datasets.
Mpl_finance is a lightweight library based on Matplotlib that provides functions to create candlestick charts. It’s lightweight and easy to use. Based on Matplotlib, so it has a similar syntax and style. The drawback is that it’s limited customization options compared to other libraries and may require additional code to create more complex charts.
All of these libraries have their own unique features and capabilities as well as pros and cons, so it’s worth exploring them to see which one best fits your needs.
